Sediment Transport under Increasing Anthropogenic Stress: Regime Shifts within the Yellow River, China

Brief Introduction
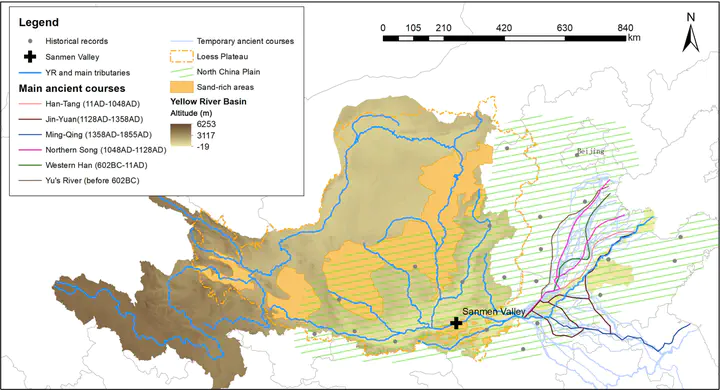
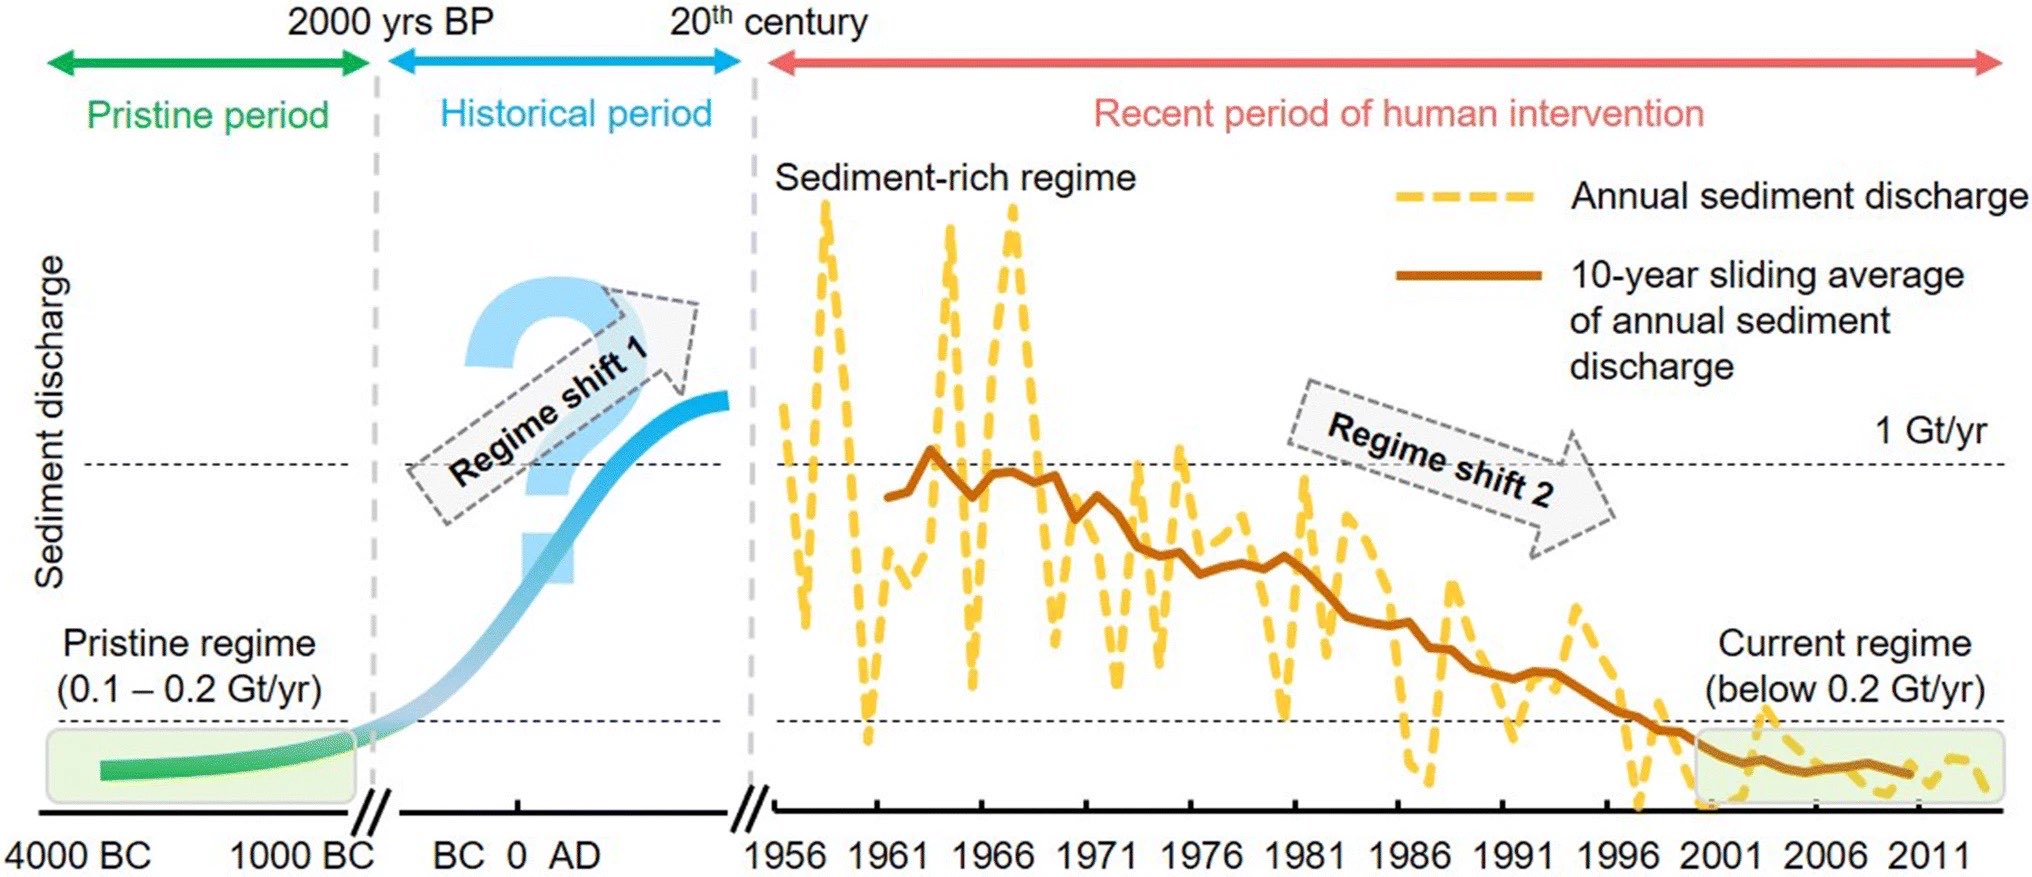
The Yellow River, China, is one of the most sediment-rich rivers in the world and has experienced two large-scale regime shifts as a result of changes in sediment transport, generating attentions from around the world (Fig. 1) (Wang et al. 2007; Wei et al. 2016; Lappalainen et al. 2018). Around 2000 years ago, China entered a more unified period of human history that saw more extensive use of the Yellow River Basin. Increasing anthropogenic stresses throughout the historical period caused the sediment discharge of the Yellow River to increase from pristine levels to a sediment-rich regime by the mid-20th century (Ren and Zhu 1994). However, human intervention in the Yellow River Basin has made structural changes and led to a dramatic decrease of the sediment discharge during the past 60 years (Yu et al. 2013; Wang et al. 2016). Therefore, it is generally believed that the annual sediment discharge of the Yellow River has returned to pristine levels, marking the most recent regime shift (Chen et al. 2015).
Here, by reanalyzing datasets from past researches, we reconsider the dynamics of climatic and anthropogenic drivers during different historical periods and assess their impacts to sediment transport of the Yellow River. Then, by detecting when key impact factors were no longer resilient to changes of previous drivers, we established a coherent understanding of the first historical regime shift within the Yellow River.

Historical sediment transport regime shifts of the Yellow River (adapted from (Wang et al. 2007). According to sediment discharge of the Yellow River, two regime shifts can divide the timeline into three periods (green: pristine period, blue: historical period, and red: the recent period of human intervention). There is still a knowledge gap that how sediment discharge changed from the pristine regime to the sediment-rich regime during the historical period
Main Results
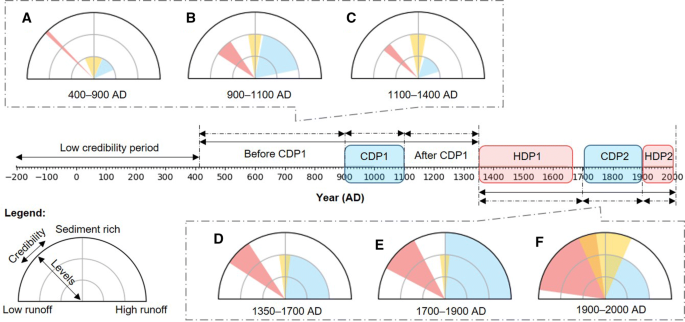
We combined three factors (Fig. 4) with their credibility for each period (Fig. 6). There are some notable differences between the processes of change before and after the period of increased sand transport mentioned above (Fig. 6, A to C with D to F). Firstly, as the most direct indicator of sediment discharge, the deposition rates, whose credibility remained weak from HDP1, had a credible increment after the ending of HDP2 (Fig. 6E to F). Secondly, although the two humid CDPs (Fig. 6, A to B and D to E) both promoted flooding breaches, no facilitation of navigating during HDP2 (Fig. 6D, E), with a beforehand change had occurred during the HDP1 (Fig. 6C, D). These indicate that the two change processes (Figs. 5 and 6, CDP1 and HDP1 to HDP2) are different, anyhow.
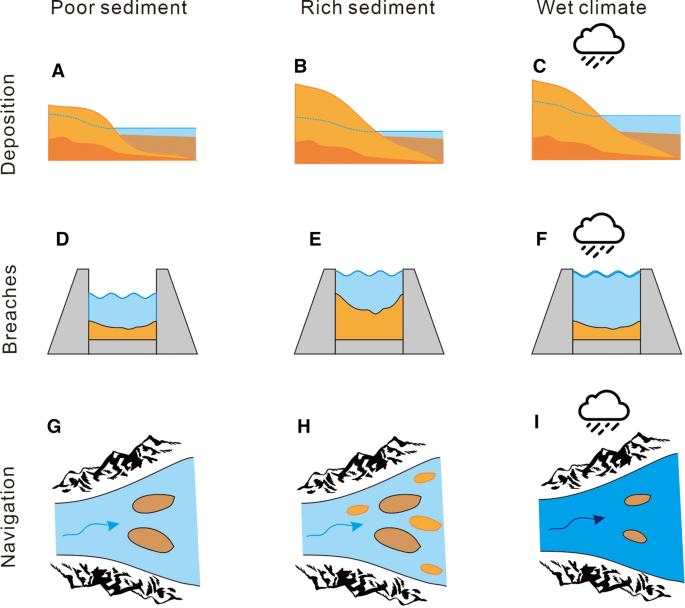
Schematic diagram of impact factors (Deposition: A–C; Breaches: D–F; Navigation: G–I) related to key features (sediment discharge and water discharge) under different categories: (1) For deposition data, higher sediment discharge (from A to B) or water discharge (from A to C) both lead to an increased downstream deposition rate. (2) For breaches data, raised channel bed by sediments (from D to E) can increase the frequency of flooding breaches, or a wetter climate (from D to F) does so, too. (3) For navigation data, increased shoals will block navigation under more abundant sediment loads (from G to H), while wet climate (from G to I) can make it easier
Combined impact factors of each period with their credibility. In each semicircular diagram, long edges of bar plots (fan-shaped radius) under polar coordinates denoting the levels of data, whose credibility expressed in arc length (see 2.3 Data and processing). Different colors show different impact factors: red, yellow, and blue, denoting deterioration of navigation, downstream deposition rate, and levee flooding breaches, respectively. Since the correlations with runoff discharge are opposite between flooding breaches and navigation, we set them in different quadrants, with upward standing high sediment discharge. In a word, a larger colored ratio indicates a higher possibility of the sediment-rich regime during a specific period: A 400–900 AD; B 900–1100 AD; C 1100–1350 AD; D 1350–1700 AD; E 1700–1900 AD; and F 1900–2000 AD
Conclusion
We investigated historical shifts in the sediment transport regime of the Yellow River to demonstrate the dynamics of the fundamental process of a regime shift. By focusing on the two main drivers of sediment transport in the Yellow River Basin, climate change and food production, we subdivided the entire historical period based on the dominant drivers. Then, we focused on the emergence of a regime shift in sediment transport by comparing impact factors between the different periods. Our results show that historical climatic changes (e.g., the Medieval Warm Period) led to changes in sediment transport. However, a regime shift, dominated by anthropogenic stresses, occurred only when the tipping point was reached, causing sediment transport to no longer be resilient to climate drivers. Since similar drivers of these abrupt and massive changes dominate globally, the case in the Yellow River is useful for understanding cascading effects within various social-ecological systems. It is, therefore, crucial to understand the relationship between regime shifts and their drivers/impacts when developing resilience management strategies within river basin systems.

